Figure 4
Home
Data Products
BC Liquor Market Dashboard
Savings Burndown Simulator
Stock Market Comparisons
Crypto Mom: Simple Portfolio Tracker
More to Come
Portfolio
Tech Blog
About
Figure 4 Tech Blog
Notes on Tech Behind Figure 4 Productions
Categories
All
(5)
Analysis
(1)
APIs
(1)
Data visualization
(1)
Quarto
(1)
R
(1)
R programming
(4)
Shiny
(1)
Statistics
(1)
Time-series
(1)
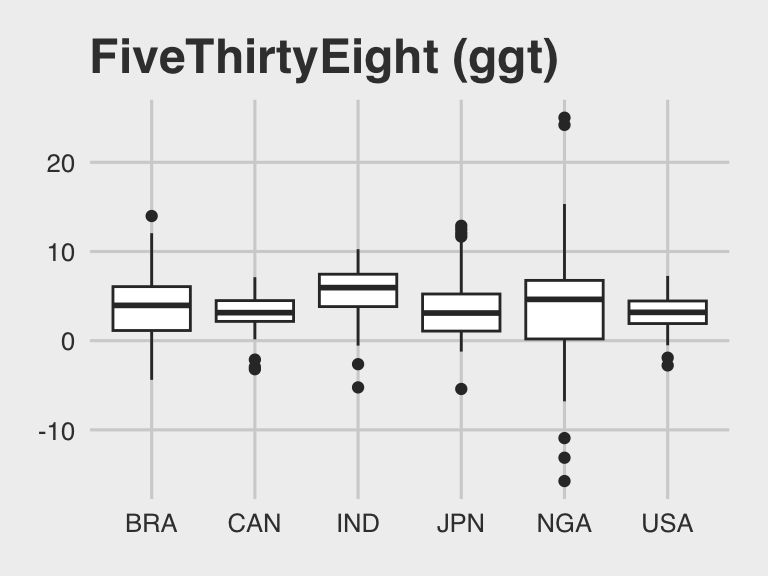
GGplot Theme Sampler: Choosing a Theme
Data visualization
R programming
Sooner or later, the times comes to move beyond the default ggplot2 grey theme and explore other options. But which theme to use? And When?
Oct 20, 2024
John Yuill
Correlation is NOT Causation…It May Not Even Be Correlation
Analysis
R programming
Statistics
Most people recognize that
correlation does not imply causation
, and that if correlation between two variables is detected, further steps must be taken to determine if there…
Mar 24, 2024
John Yuill
Quarto Shinylive Experiment: Promising for Limited Use
R programming
Quarto
Shiny
Simple example demonstrates the benefits of embedding Shiny apps in Quarto documents. This technology has some great potential for expanding the use of Shiny apps, although…
Jan 27, 2024
John Yuill
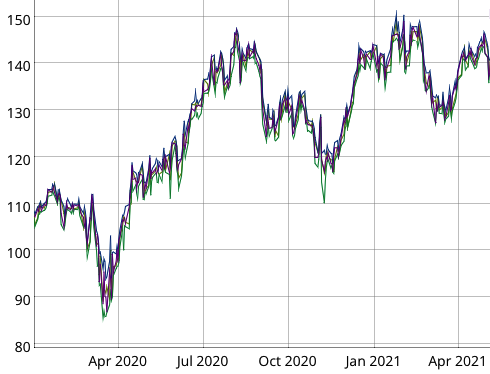
R Time Series Objects vs Data Frames: Advantages and Limitations
R programming
Time-series
As I learn more and more about R, questions often arise about which packages/methods/tools to use for a given situation. R is a vast - and growing - universe and I’m not…
Jan 30, 2022
John Yuill
Google Trends + R: gtrendsR for Powerful Trend Analytics
R
APIs
Google Trends is a popular tool for all manner of curiousity related to trends in search activity on the Google search engine:
Jan 16, 2022
John Yuill
No matching items